
CS log
Genmini for data scientists 본문
- Use Colab Enterprise Python notebooks inside BigQuery Studio.
- Use BigQuery DataFrames inside of BigQuery Studio.
- Use Gemini to generate code from natural language prompts.
- Build a K-means clustering model.
- Generate a visualization of the clusters.
- Use the text-bison model to develop the next steps for a marketing campaign.
- Clean up project resources.
dataset 생성
python notebook 생성
이후 기본적인 라이브러리를 불러오는 등 설정을 해준 후
from google.cloud import bigquery
from google.cloud import aiplatform
import bigframes.pandas as bpd
import pandas as pd
from vertexai.language_models._language_models import TextGenerationModel
from bigframes.ml.cluster import KMeans
from bigframes.ml.model_selection import train_test_split

project_id = 'qwiklabs-gcp-00-8ea7d7dd7cbd'
dataset_name = "ecommerce"
model_name = "customer_segmentation_model"
table_name = "customer_stats"
location = "us-central1"
client = bigquery.Client(project=project_id)
aiplatform.init(project=project_id, location=location)
Create and import the ecommerce.customer_stats table
Next you will store data from thelook_ecommerce BigQuery public dataset into a new table entitled customer_status in your ecommerce dataset.
%%bigquery
CREATE OR REPLACE TABLE ecommerce.customer_stats AS
SELECT
  user_id,
  DATE_DIFF(CURRENT_DATE(), CAST(MAX(order_created_date) AS DATE), day) AS days_since_last_order, ---RECENCY
  COUNT(order_id) AS count_orders, --FREQUENCY
  AVG(sale_price) AS average_spend --MONETARY
  FROM (
      SELECT
        user_id,
        order_id,
        sale_price,
        created_at AS order_created_date
        FROM `bigquery-public-data.thelook_ecommerce.order_items`
        WHERE
        created_at
            BETWEEN '2022-01-01' AND '2023-01-01'
  )
GROUP BY user_id;

You will see the BigQuery DataFrame output with the first 10 rows of the dataset displayed.
Generate the K-means clustering model
Now that you have your customer data in a BigQuery DataFrame, you will create a K-means clustering model to split the customer data into clusters based on fields like order recency, order count, and spend, and you will then visualize these as groups within a chart directly within the notebook.
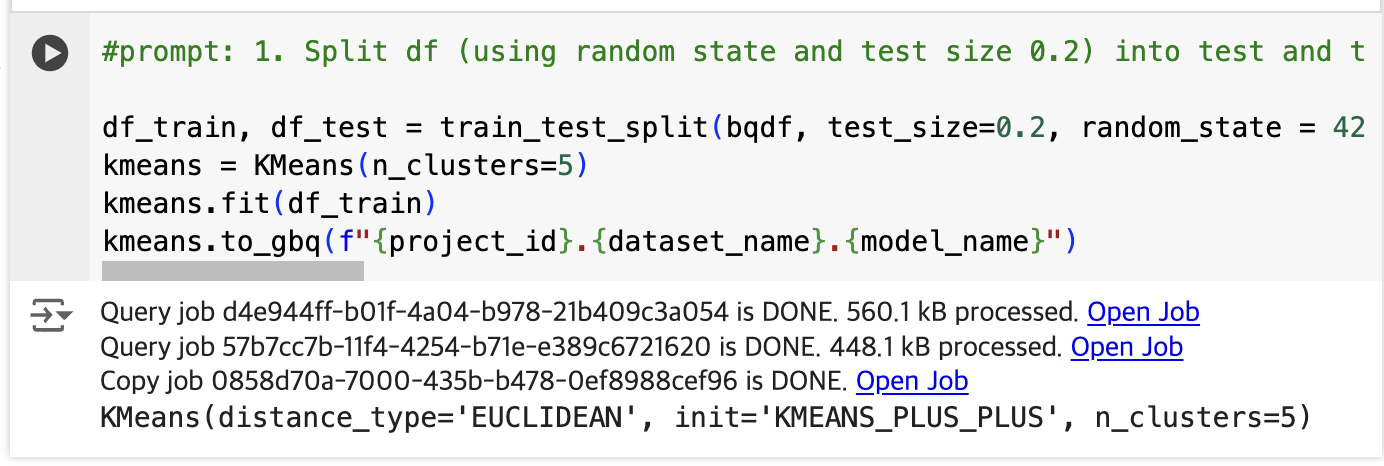
model이 생성되었다.
# prompt: 1. Using predictions_df, and matplotlib, generate a scatterplot. 2. On the x-axis of the scatterplot, display days_since_last_order and on the y-axis, display average_spend from predictions_df. 3. Color by cluster. 4. The chart should be titled "Attribute grouped by K-means cluster."

import matplotlib.pyplot as plt

# Create the scatter plot
plt.figure(figsize=(8, 6))
plt.scatter(predictions_df['days_since_last_order'], predictions_df['average_spend'], c=predictions_df['CENTROID_ID'], cmap='viridis')
plt.xlabel('Days Since Last Order')
plt.ylabel('Average Spend')
plt.title('Attribute grouped by K-means cluster')
plt.colorbar(label='Cluster ID')
plt.show()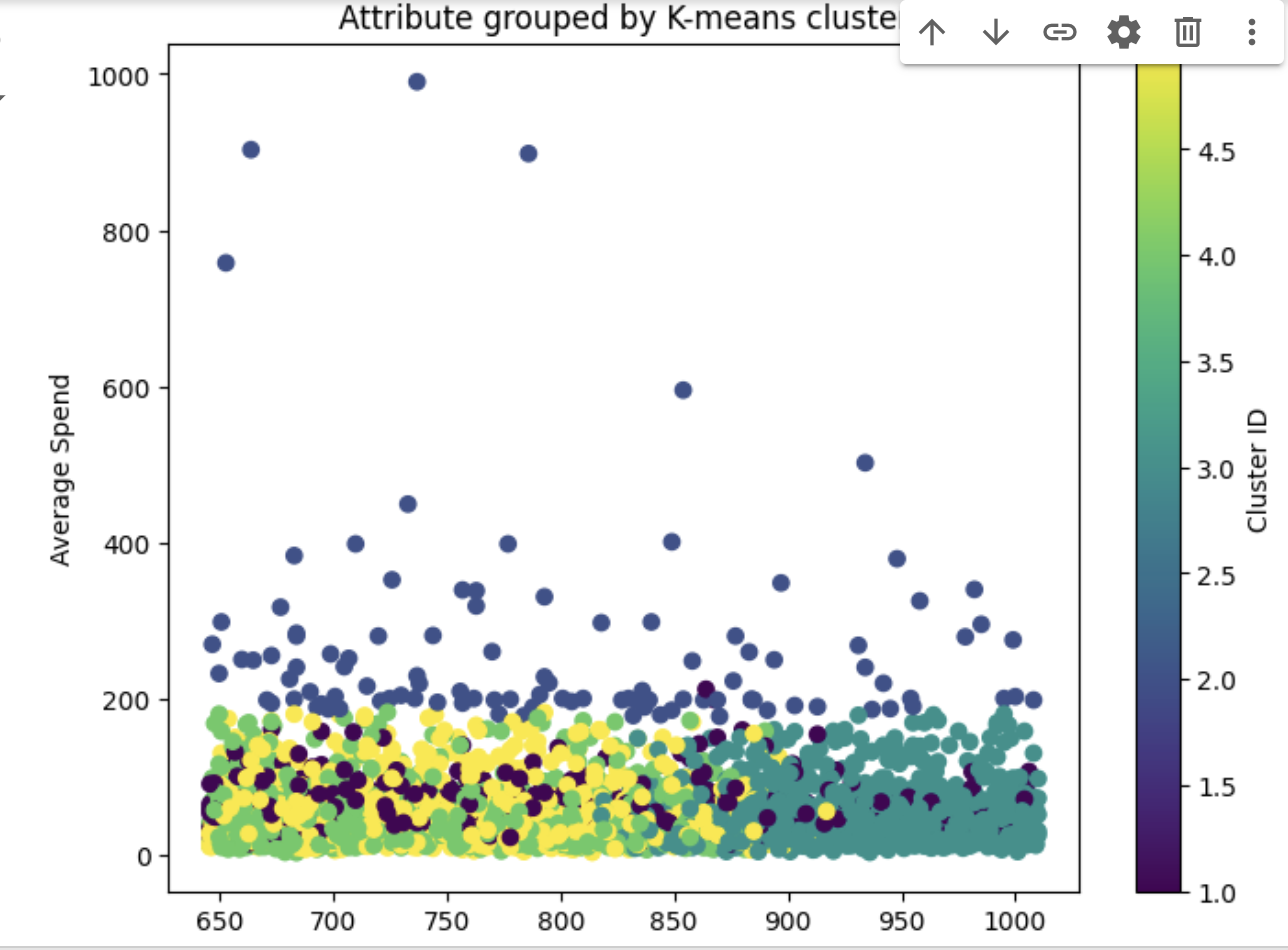
Task 5. Generate insights from the results of the model
In this task, you generate insights from the results of the model by performing the following steps:
- Summarize each cluster generated from the K-means model
- Define a prompt for the marketing campaign
- Generate the marketing campaign using the text-bison model
Summarize each cluster generated from the K-means model
query = """
SELECT
 CONCAT('cluster ', CAST(centroid_id as STRING)) as centroid,
 average_spend,
 count_orders,
 days_since_last_order
FROM (
 SELECT centroid_id, feature, ROUND(numerical_value, 2) as value
 FROM ML.CENTROIDS(MODEL `{0}.{1}`)
)
PIVOT (
 SUM(value)
 FOR feature IN ('average_spend',  'count_orders', 'days_since_last_order')
)
ORDER BY centroid_id
""".format(dataset_name, model_name)

df_centroid = client.query(query).to_dataframe()
df_centroid.head()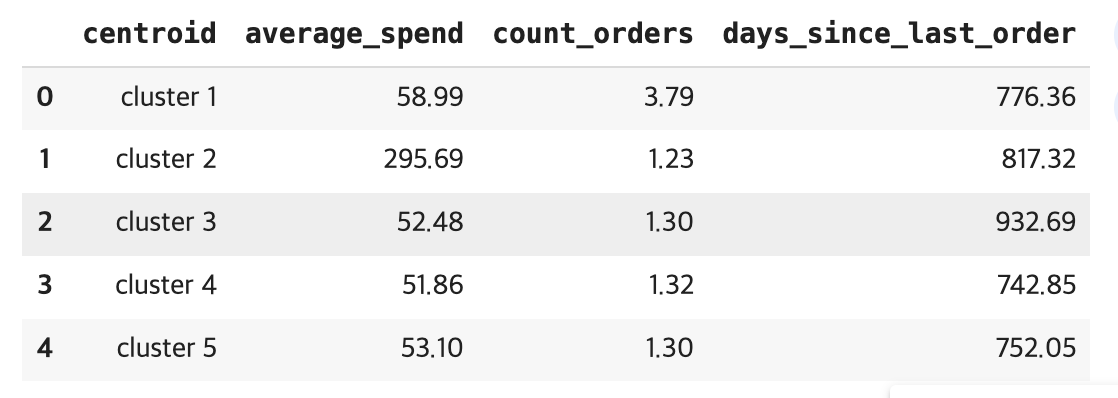
df_query = client.query(query).to_dataframe()
df_query.to_string(header=False, index=False)

cluster_info = []
for i, row in df_query.iterrows():
 cluster_info.append("{0}, average spend ${2}, count of orders per person {1}, days since last order {3}"
  .format(row["centroid"], row["count_orders"], row["average_spend"], row["days_since_last_order"]) )

cluster_info = (str.join("\n", cluster_info))
print(cluster_info)

# result
cluster 1, average spend $58.99, count of orders per person 3.79, days since last order 776.36
cluster 2, average spend $295.69, count of orders per person 1.23, days since last order 817.32
cluster 3, average spend $52.48, count of orders per person 1.3, days since last order 932.69
cluster 4, average spend $51.86, count of orders per person 1.32, days since last order 742.85
cluster 5, average spend $53.1, count of orders per person 1.3, days since last order 752.05
'AI > NLP' 카테고리의 다른 글
| [프로젝트] Leveraging LLM Reasoning Enhances Personalized Recommender Systems (18) | 2024.11.14 |
|---|---|
| Gemini for Data Scientists and Analysts (1) | 2024.10.02 |
| Integrating Applications with Gemini 1.0 Pro on Google Cloud (4) | 2024.09.30 |
| Speech to Text Transcription with the Cloud Speech API (2) | 2024.09.25 |
| Entity and Sentiment Analysis with the Natural Language API (2) | 2024.09.23 |
'AI/NLP' Related Articles
more


